Even really helpful, I found R Marries NetLogo: Introduction to the RNetLogo Package (Jan C. Thiele, 2014, https://www.jstatsoft.org/article/view/v058i02/v58i02.pdf) little too complicated for the beginners in R and NetLogo alone.
A complete beginners guide how to read and use NetLogo BehaviorSpace data in R
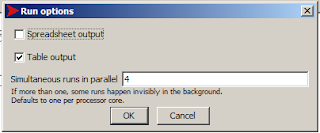
Firstly, we need to export a data in table output from NetLogo BehaviorSpace.

Sure, you can keep the Spreadsheet format as well, but in R, the Table output is more suitable.
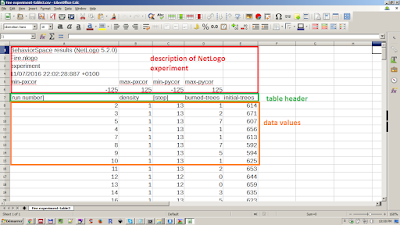
First, have a look of the structure of the BehaviorSpace Table output data. Data consist of information about the executed NetLogo experiment and applied model (description....), and of the true table: consisted of table header (column names) and reporter values (data values). The columns represent reporters' values over simulation run.

Now, we are ready to read NetLogo BehaviorSpace Data in R.
Firstly, we need to identify the working directory, where your NetLogo table is stored
# set working directory
setwd("c:/Users/Book/Desktop")
Now, we need to load the table (read.table()), skip the "description data" part of table (thus skip first 6 rows), and read table correctly by defining the columns by sep and quote.
# --------------------------------------------------------
# import .csv files by names
# skip the first columns but keep names of columns
my.df<-read.table("Fire experiment-table.csv",
header = T, # set columns names true
sep = ",", # define the separator between columns
skip = 6, # skip first 6 rows
quote = "\"", # correct the column separator
fill = TRUE ) # add blank fields if rows have unequal length
Check if table has been read correctly
head(my.df)
Plot the data as boxplot
boxplot(burned.trees ~ density,
data = my.df,
col = "lightgray",
main = "",
xlab = "density",
ylab = "burned trees")
Tadaaa !!!

nice post.
ReplyDeleteDo you by any chance have a material explaining how to deal with spreadsheet exported data?